As the world comes to terms with the effects of climate change, ‘big data’ analytics firm StreetLight Data Inc. has released its first annual index that ranks the environmental impact of transportation for the 100 largest metropolitan areas in the USA.
According to the US Environmental Protection Agency, burning fossil fuels for transportation is the top contributor to greenhouse gas (GHG) emissions in the country, while the United Nations Emissions Gap Report 2019 notes that the USA is second only to China as the world’s top GHG producer. The Global Carbon Project also indicates that the world is setting new emissions records every year, which puts the country’s transportation experts and city planners in the driver’s seat to effect change. StreetLight Data, Inc recognises that managing transportation is a major engine of climate change mitigation, and is providing new data to enable cities and agencies to manage and measure their progress.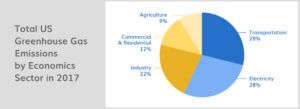
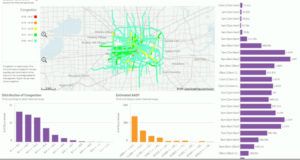
The company has unveiled its first annual US Transportation Climate Impact Index, which ranks the country’s 100 most populous metro areas based on several carbon-related transportation factors, including Vehicle Miles Travelled (VMT), bicycle and pedestrian commute metrics, population density, and circuity (the difference between an actual route taken and a straight line between origin and destination). The nationwide multimode mobility metrics pioneered by StreetLight allow its data scientists to measure more than just transportation infrastructure, as they can illustrate real-life mobility activity and point cities toward behaviour with the highest climate impact for their locality.
As such, the 2020 US Transportation Climate Impact Index goes far beyond traditional transportation design-based measures, such as how many miles of bicycle paths exist, and draws on performance-based metrics such as how much actual bike commuting people do. This fresh perspective highlights the tight connection between transportation and urban planning. It offers insight into ways that cities with extensive car travel can successfully offset that carbon output, and shows that commuters might walk or cycle even in the country’s harshest winter weather.
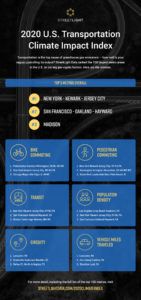
 For the Index, the company ranked the country’s largest metro areas from 1 (best) to 100 (worst) on six individual factors: VMT, bike commuting miles, pedestrian commuting miles, transit ridership, population density, and circuity. The top metro areas generally have low VMT, high mileage in bike and pedestrian commuting, high per-capita transit use, high population density, and low circuity. The top 10 are:
- New York (New York State) / Newark-Jersey City (New Jersey)
- San Francisco / Oakland / Hayward (California)
- Madison (Wisconsin)
- Philadelphia (Pennsylvania) / Camden (New Jersey) / Wilmington (Delaware)
- Boston / Cambridge / Newton (Massachusetts)
- San Jose / Sunnyvale / Santa Clara (California)
- Des Moines / West Des Moines (Iowa)
- Lancaster (Pennsylvania)
- New Haven / Milford (Connecticut)
- Buffalo / Cheektowaga / Niagara Falls (New York State)
“Studying sustainable transportation metrics can help urban and community planners understand the potential for change and where to improve,” said Laura Schewel, CEO and co-founder of StreetLight Data. “For example, can a city find ways to encourage more bike and pedestrian travel? Does the city’s land-use planning lend itself to increasing density? A goal of our 2020 US Transportation Climate Impact Index is to use objective and clear data to help spark discussions and new ways of addressing mobility in context.”