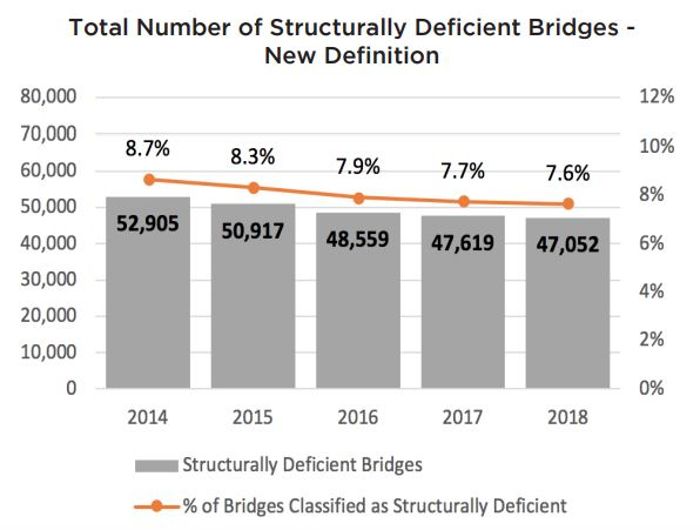
The American Road & Transportation Builders Association (ARTBA) analysis of the recently released US Department of Transportation (USDOT) 2018 National Bridge Inventory (NBI) database reveals 47,052 bridges are classified as ‘structurally deficient’ and in poor condition.
Although the number of structurally deficient bridges is down slightly compared to 2017, the pace of improvement has slowed to the lowest point since ARTBA began compiling its annual status report five years ago.
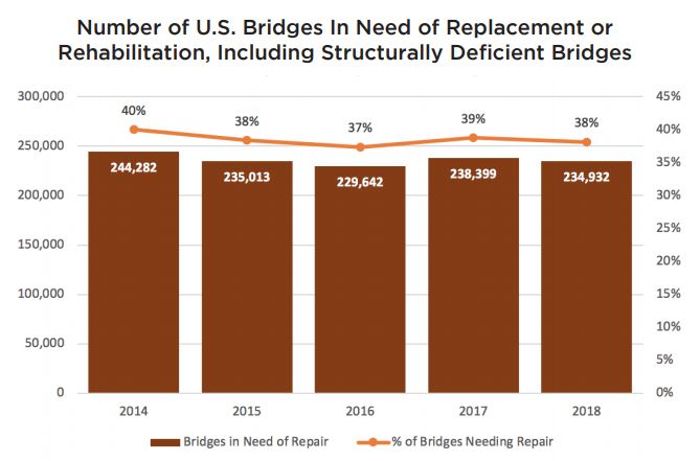
Analysis of the USA’s 616,087 bridges showed the pace of repair slowed to the extent that deficient bridges dropped by just 1% last year. Including structurally deficient bridges, there are nearly 235,000 bridges, or about 38%, in need of some sort of structural repair, rehabilitation or replacement, according to ARTBA’s analysis of the NBI data. The association estimates the cost to make the identified repairs is nearly US$171bn.
The report also shows that:
- The length of structurally deficient bridges if placed end-to-end would span nearly 1,100 miles (1,770km);
- Cars, trucks and school buses cross the compromised structures 178 million times every day, with 1,775 on the Interstate Highway System;
- The most traveled structurally deficient bridges are on parts of Route 101, Interstate 405 and Interstate 5 in California, where daily crossings are as high as 289,000 per day;
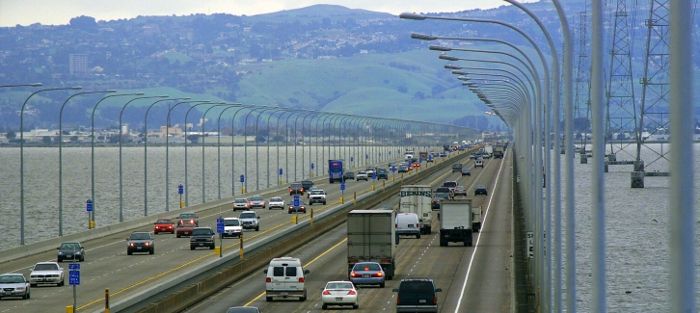
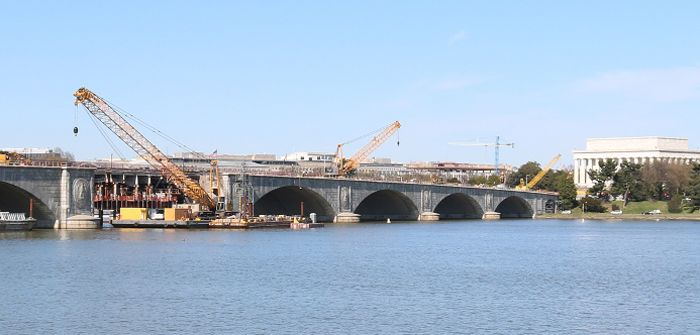
- The Brooklyn (New York), Arlington Memorial (Washington DC), Pensacola (Florida), San Mateo-Hayward (California) and Vicksburg (Mississippi) bridges are among notables on the list;
- Average age of a structurally deficient bridge is 62 years, compared to 40 years for non-deficient bridges;
- A total of 18,842 (one out of every three) Interstate highway bridges have identifiable repair needs;
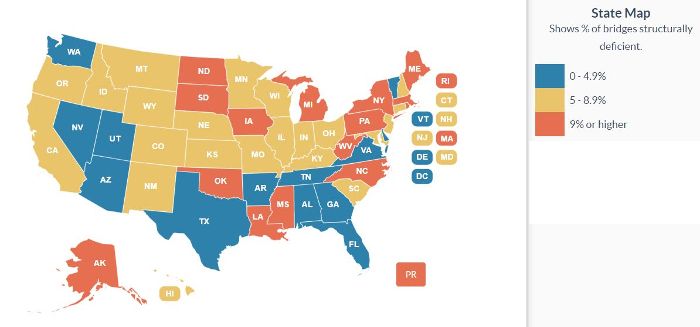
- States with the largest number of structurally deficient bridges are Iowa (4,675 bridges), Pennsylvania (3,770), Oklahoma (2,540), Illinois (2,273) and Missouri (2,116); and
- Those with the most structurally deficient bridges as a percentage of their total bridge inventory are Rhode Island (23%), West Virginia (19.8%), Iowa (19.3%), South Dakota (16.7%) and Pennsylvania (16.5%).
 ARBTA notes that the Federal Highway Administration (FHWA) changed the definition of ‘structurally deficient’ in January 2018 as part of a final rule on highway and bridge performance measures required by the 2012 MAP-21 federal surface transportation law. Two measures FHWA previously used to classify bridges as structurally deficient are no longer used. This includes bridges where the overall structural evaluation was rated in poor or worse condition, or where the adequacy of waterway openings was insufficient. The new definition limits the classification to bridges where one of the key structural elements, such as the deck, superstructure, substructure or culverts, are rated in poor or worse condition.
“Sadly, this report is no April Fool’s joke. At the current pace, it would take more than 80 years to replace or repair the nation’s structurally deficient bridges. That’s longer than the average life expectancy of a person living in the USA,” said Dr Alison Premo Black, the ARTBA chief economist who conducted the analysis. “America’s bridge network is outdated, underfunded and in urgent need of modernization. State and local government just haven’t been given the necessary resources to get the job done.”
