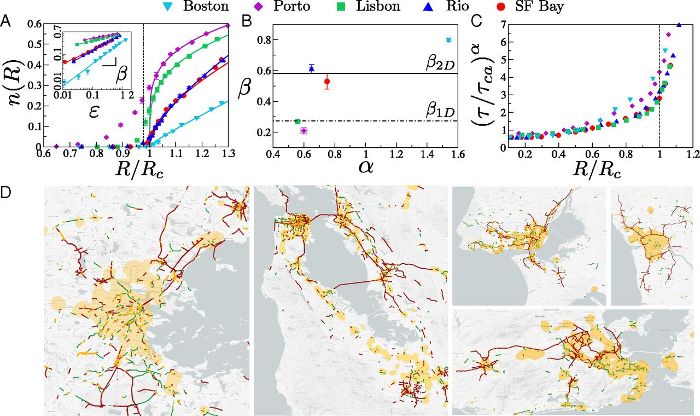
A new study from researchers at Australia’s University of New South Wales in Sydney (UNSW) and the USA’s University of California at Berkeley (UCB) has found that the transition from heavy traffic to complete gridlock follows the same quantifiable pattern in cities around the world.
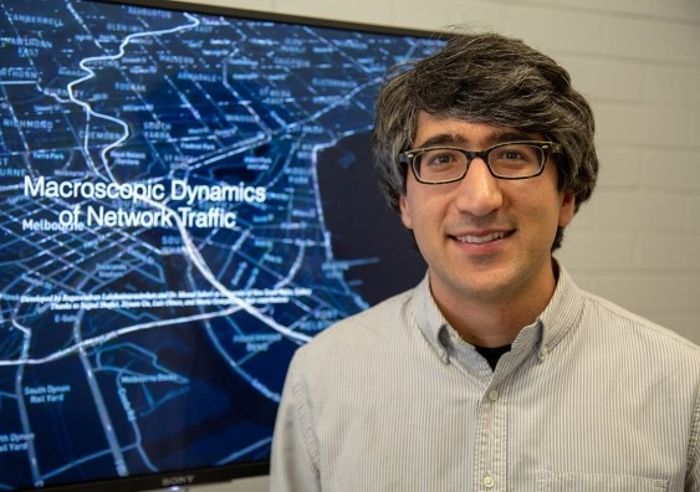
Following research involving teams from UCB and the UNSW’s Research Centre for Integrated Transport Innovation (rCITI), transport authorities will be able to better predict when traffic congestion threatens to become gridlocked and take steps to intervene. For the paper authored by UNSW’s Dr Meead Saberi in collaboration with UCB’s Marta Gonzales, data from six major global cities was analyzed to discover whether there were recognizable patterns to the development of major traffic congestion. The research findings reveal new directions for studying urban traffic with a statistical physics framework.
The study examined traffic patterns in Boston and the San Francisco Bay area in the USA, Porto and Lisbon in Portugal, and Rio de Janeiro in Brazil, as well as computer modelling of Melbourne’s traffic system in Australia. The researchers compared individual drivers’ travel times and how long it took for them to reach their destinations from the beginning of peak hour with drivers starting their journeys over the next hour of that peak period. The time it took drivers to reach their destinations was labelled ‘recovery time’.

The researchers found that as ‘recovery time’ passed the critical threshold where cars using the network outweighed the network’s full capacity, traffic started to move beyond congestion to network collapse, or gridlock. Despite the various differences between cities in topography, population size, infrastructure, demand and other individual characteristics, transition to gridlock happens in every city in a similar fashion. The point when this transition happens may be unique to each city, but the researchers now have a quantifiable measure for it.
The authors say transport authorities and governments could use the findings to understand when and how traffic forms and how likely it could develop into network collapse. Monitoring the number of vehicles entering the network and the recovery time could provide an early indication of whether a gridlock is likely to happen or not.
“We have found that this simple ‘recovery time’ measure is directly related to demand and supply; no surprise. What is surprising is that all the six cities that we have studied perform similarly,” explained Dr Saberi. “The demand over supply ratio that we have measured is the ratio of the vehicle kilometers travelled in a city to the total vehicle distance the road network can support per hour. When this ratio exceeds a critical value, we see transition to gridlock.”
 Saberi added, “We’d like to follow up the study by looking at other patterns of the ‘spreading phenomenon’ that traffic congestion may follow. The next step is to go totally out of the box and use methods in public health, such as those to track how infectious diseases spread around the world, to monitor and predict traffic.”


